Game Jam Data Sheet

I’ve gone ahead and updated my spreadsheet for the 2023 Winter jam!

Some interesting data:

  • There were 15 3-4 star games, more then ever before
  • There were the second most entries in this jam, only second to Summer 2022
  • Art and creativity were on average given higher ratings then the other two areas
  • On average, each game was only rated by 38% of voters
  • There were 989 ratings across all the games

Check out the full sheet to see where your game is within the average :smiley:

6 Likes

3 Likes

Thanks for the Data Sheet, this helps a lot.

Also wow, only 2 games have ever gotten a score over 4

4 Likes

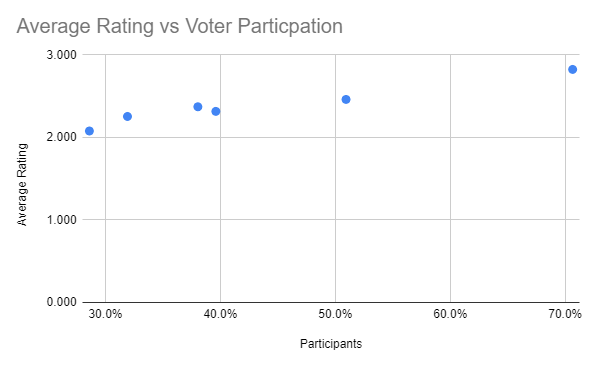
Another thing I noticed:
image
Games that have less people generally have more voter participation, and there are also more high quality games. It seems that when there is a higher number of participants, it’s usually people who will make lower rated games.

1 Like

image

It seems that either: People vote more when there are more good games, or: when there are more voters games tend to get a higher rating.

1 Like

that’s probably because of people who just post new games with flowlab sprites barely ever vote, and considering there’s only so many talented flowlab users, and they will all almost always participate, the less people means the less people putting in terrible default sprite games

2 Likes